Visualization
Built with Tableau
Originally the visuals for this project were being built via the python libaries, Matplotlib and Seaborn.
Upon further research, and due to compilation time and quality purposes, Tableau was used fo the visuals.

Originally the visuals for this project were being built via the python libaries, Matplotlib and Seaborn.
Upon further research, and due to compilation time and quality purposes, Tableau was used fo the visuals.
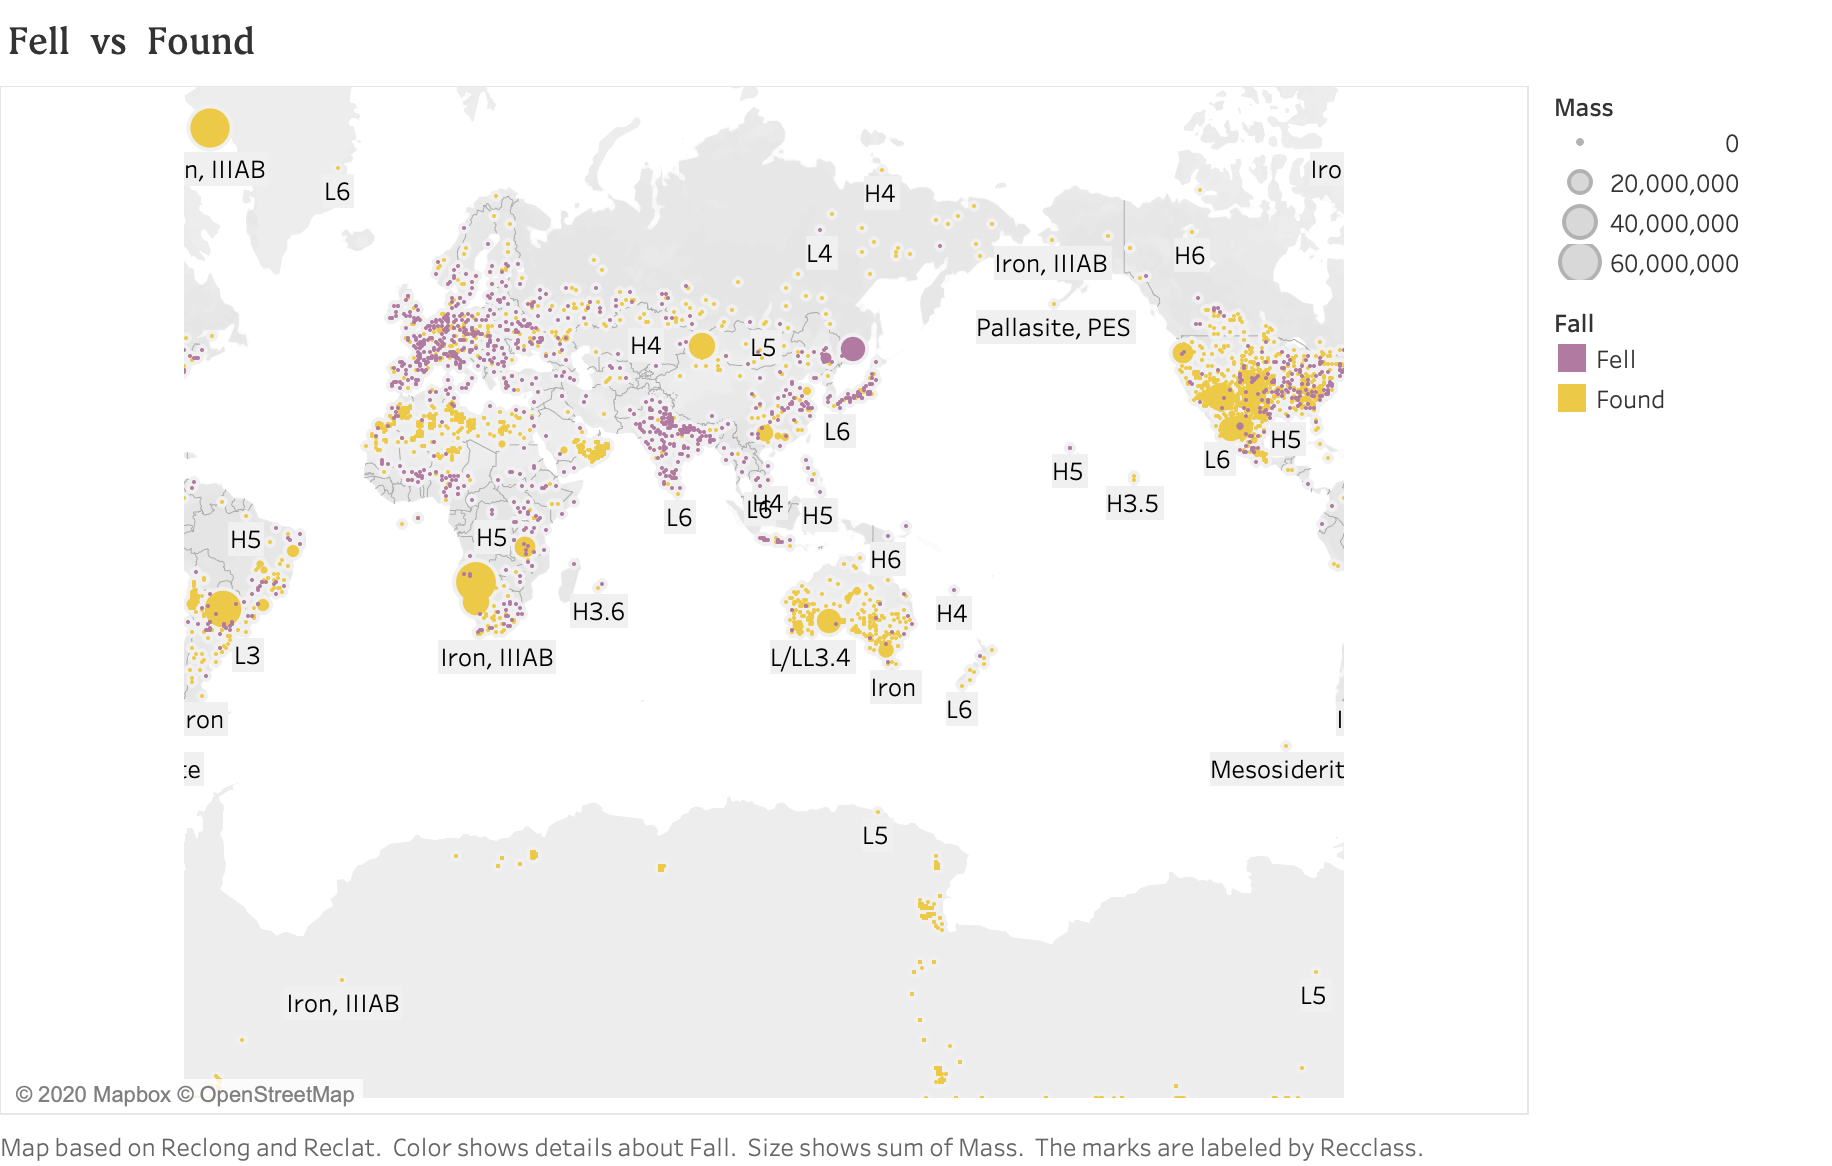
Fell meteors are ones that were observed AS they were falling.
Found meteors are ones that were located on the ground AFTER impact.
"Count of Fall and Fall as an attribute. Color shows details about Fall. Size shows count of Name. The marks are labeled by count of Fall and Fall as an attribute."
...
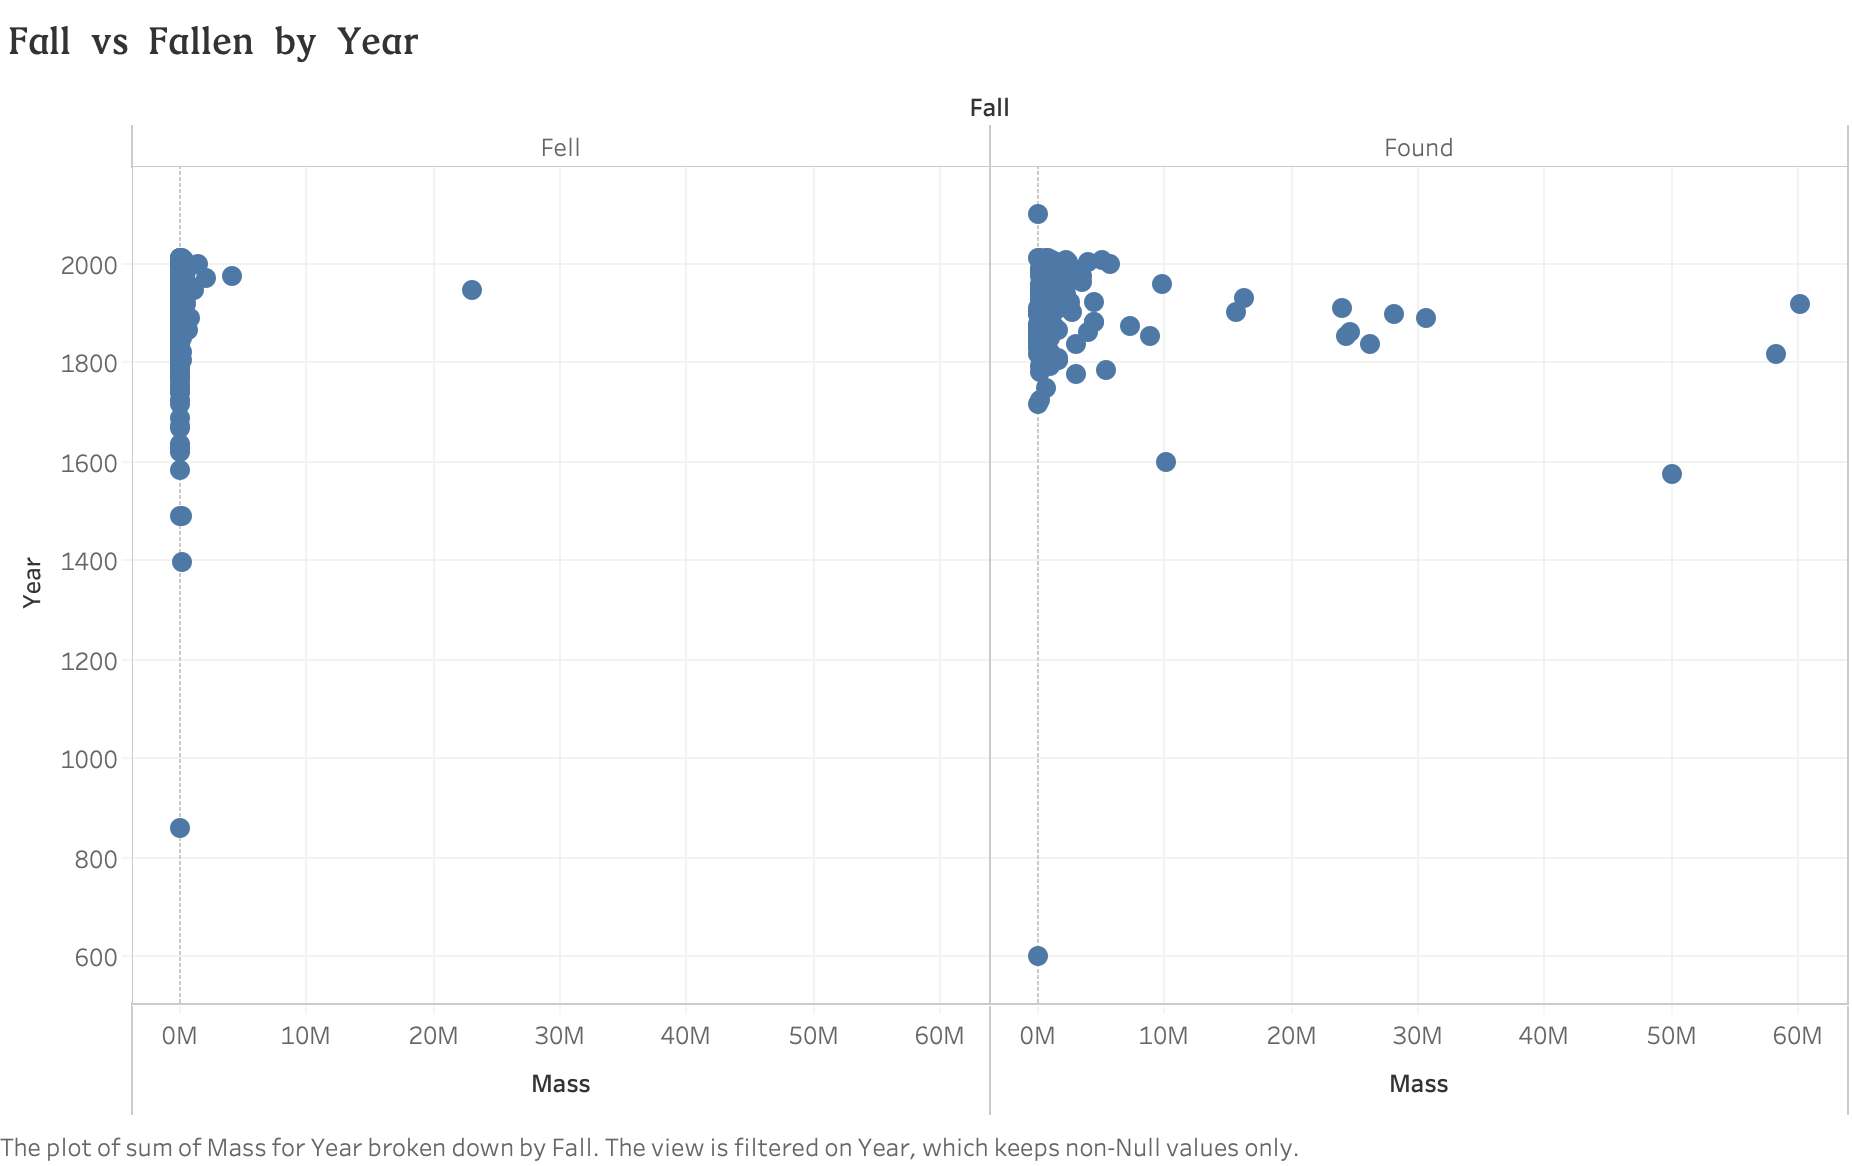
"The plot of sum of Mass for Year broken down by Fall. The view is filtered on Year, which keeps non-Null values only."
...
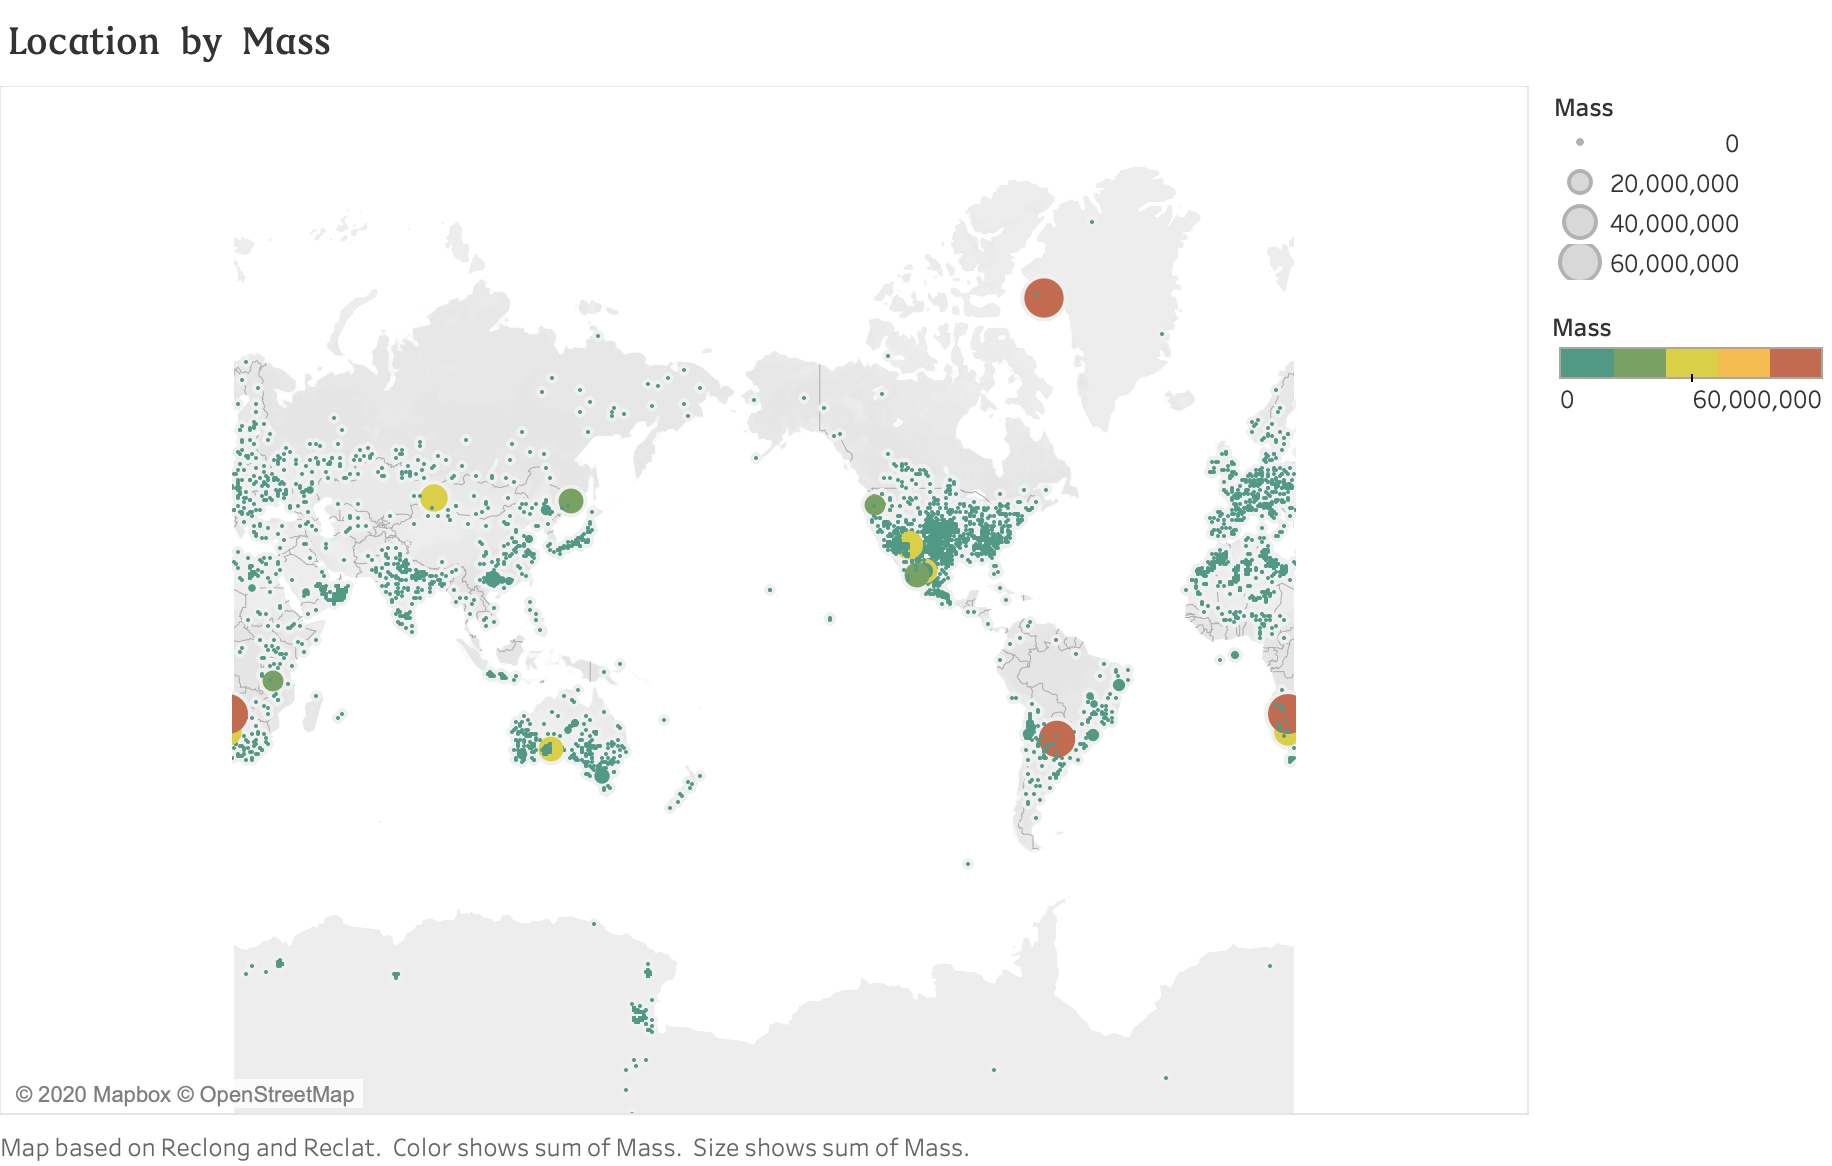
"Map based on Reclong and Reclat. Color shows sum of Mass. Size shows sum of Mass."
...
"Map based on Reclong and Reclat. Color shows details about Fall. Size shows sum of Mass. The marks are labeled by Recclass."
...
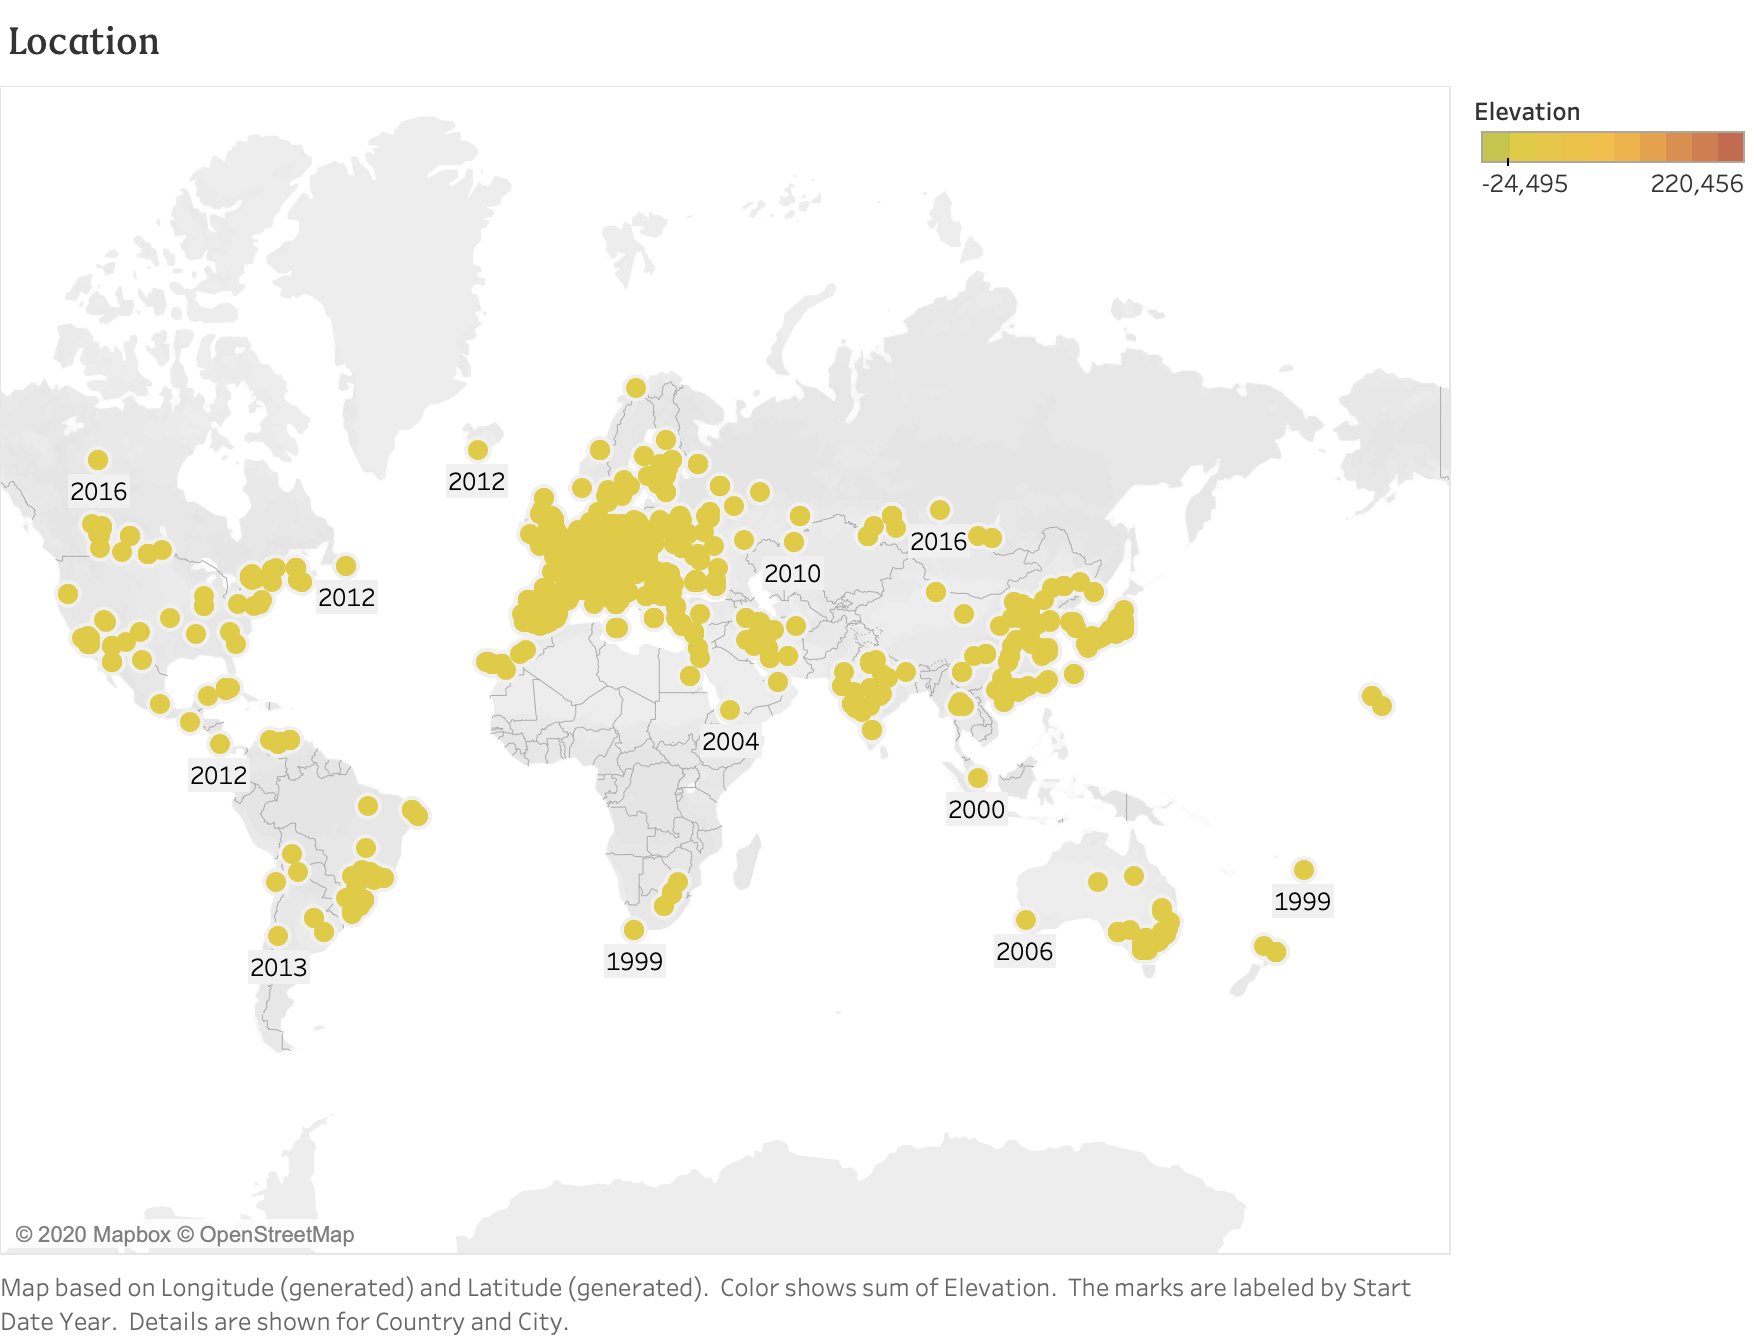
"Map based on Longitude (generated) and Latitude (generated). Color shows sum of Elevation. Details are shown for Country and City."
...
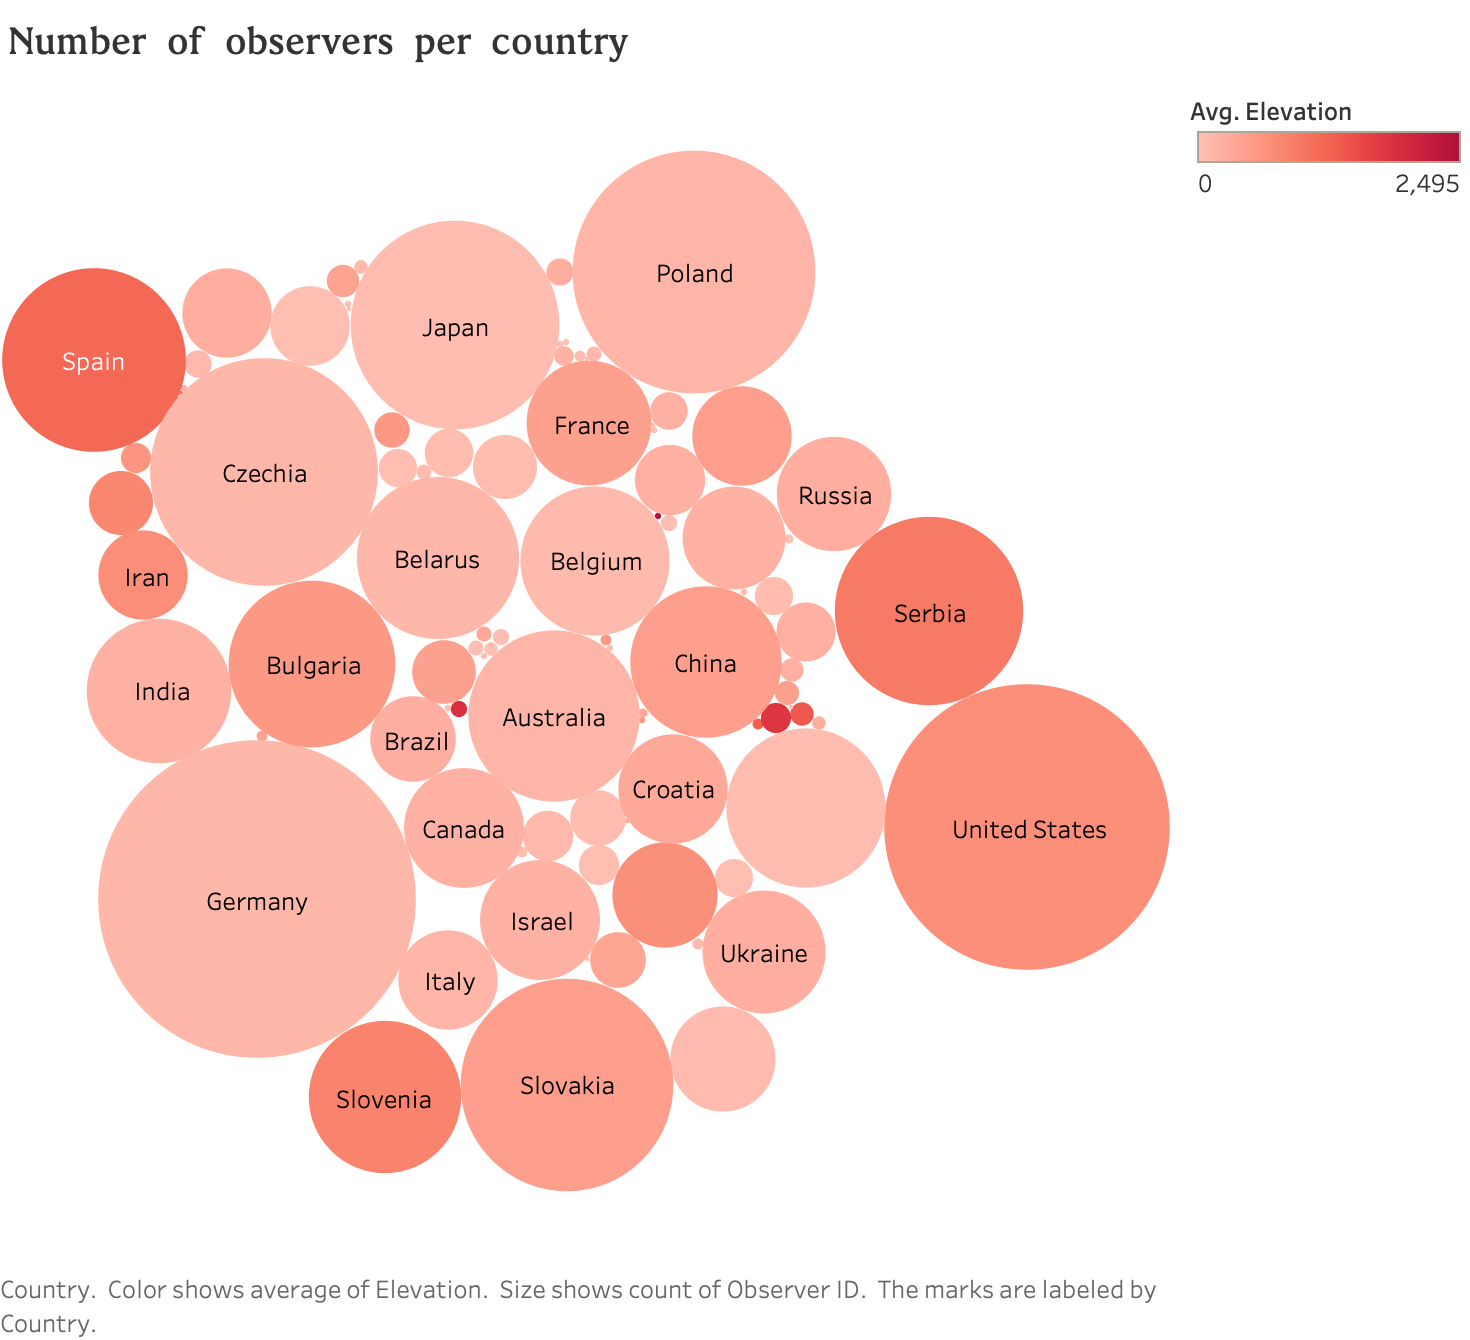
"Country. Color shows average of Elevation. Size shows count of Observer ID. The marks are labeled by Country."

"Count of Start Date broken down by Start Date Year vs. Country."
...
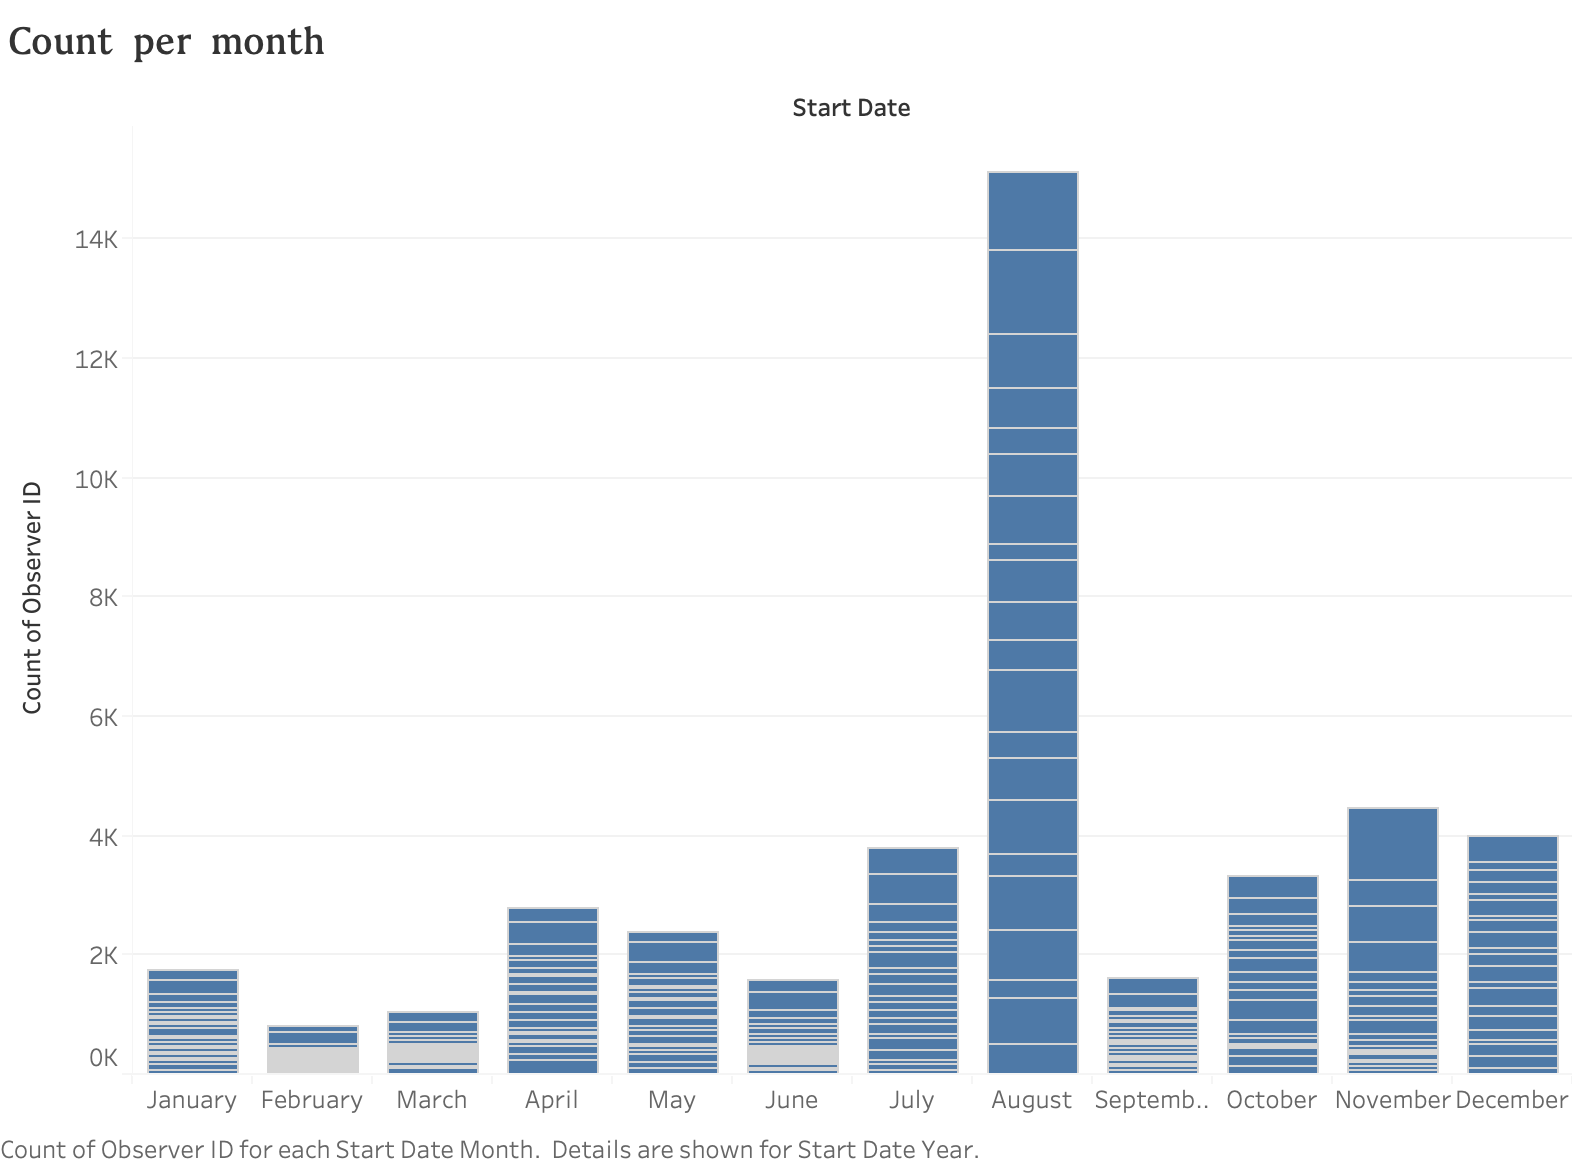
"Count of Observer ID for each Start Date Month. Details are shown for Start Date Year."
"The Perseids are the most popular meteor shower as they peak on warm August nights as seen from the northern hemisphere. The Perseids are active from July 17 to August 24. They reach a strong maximum on August 12 or 13, depending on the year. Normal rates seen from rural locations range from 50-75 shower members per hour at maximum.The Perseids are particles released from comet 109P/Swift-Tuttle during its numerous returns to the inner solar system. They are called Perseids since the radiant (the area of the sky where the meteors seem to originate) is located near the prominent constellation of Perseus the hero when at maximum activity."
...
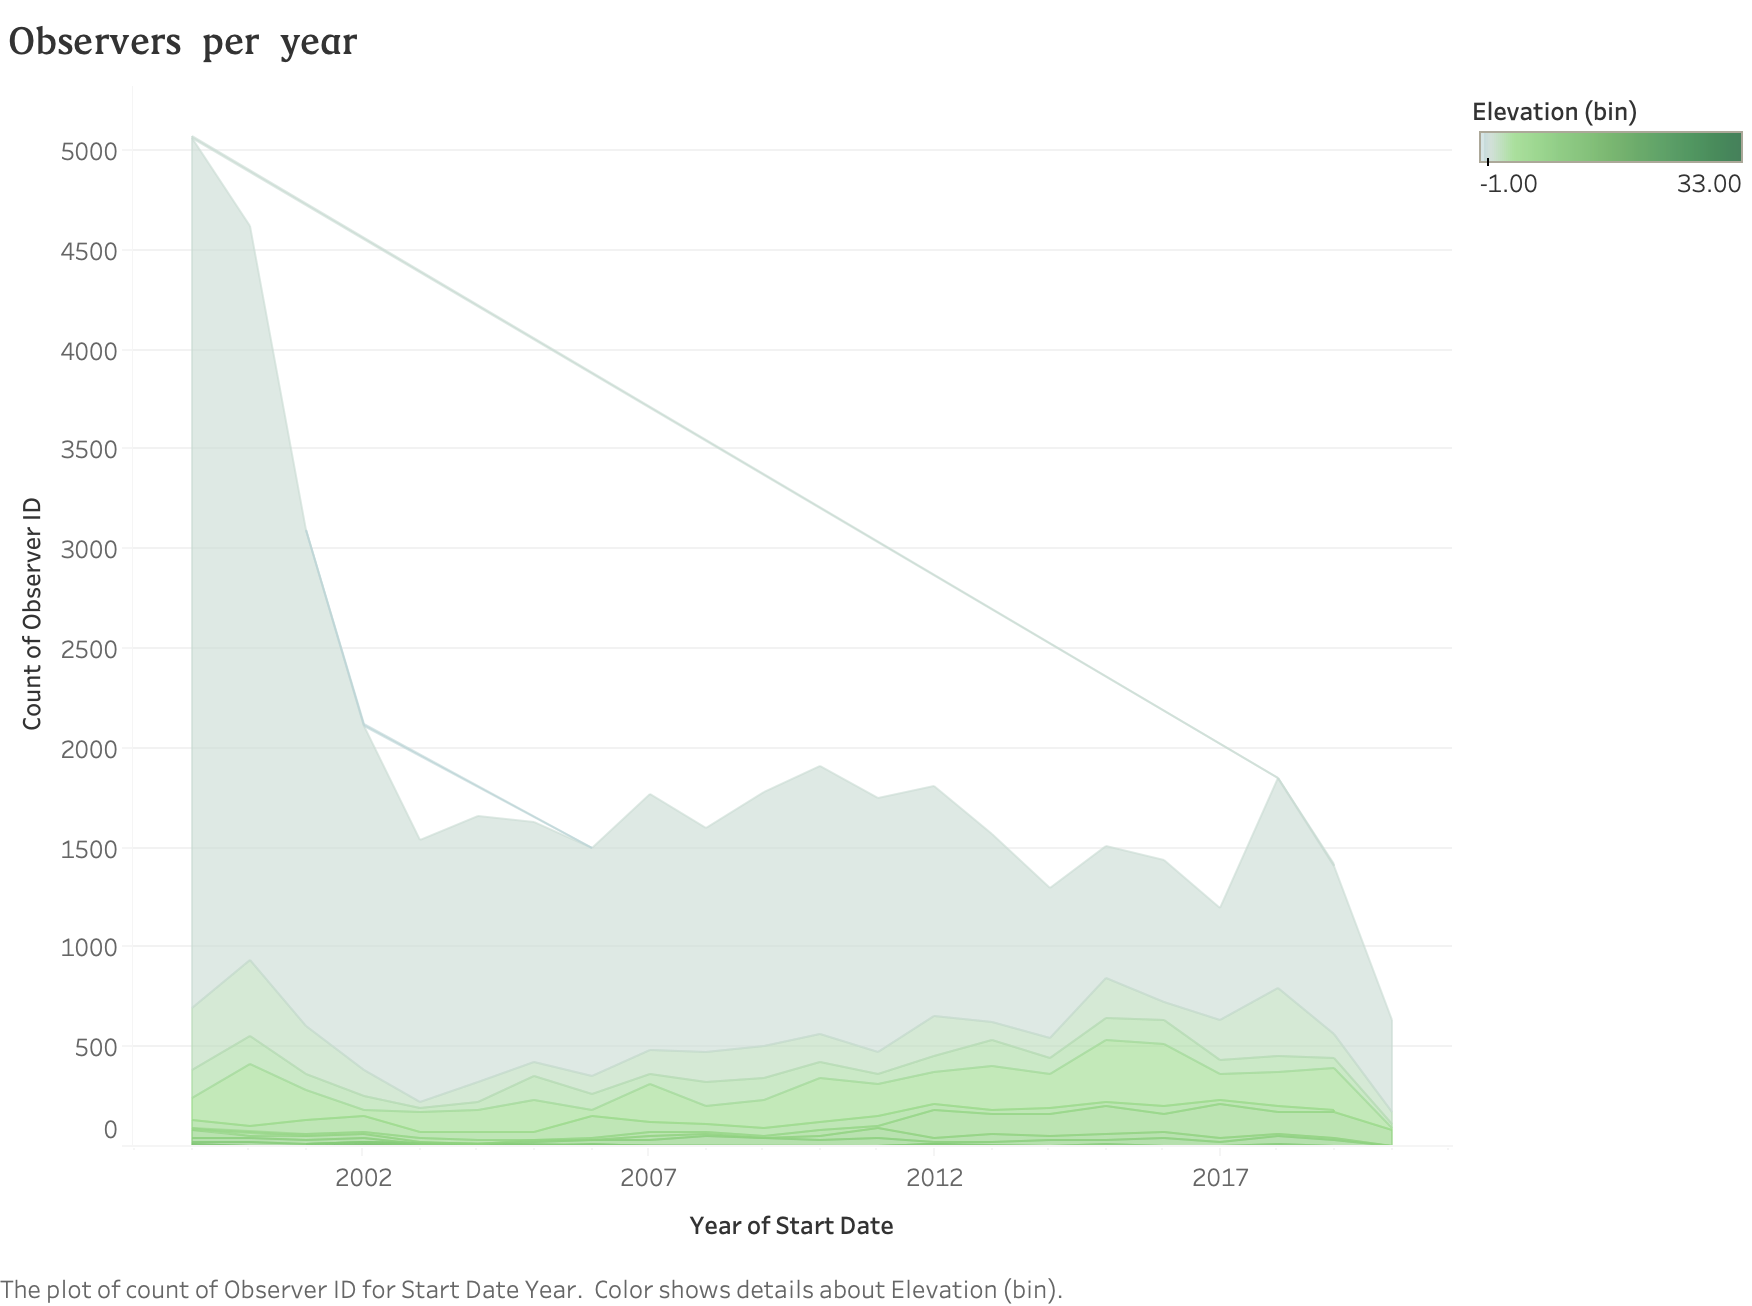
"The plot of count of Observer ID for Start Date Year. Color shows details about Elevation (bin)."